
AL/ML Workflows
Streamlining Siri's AI/ML Data Pipeline
Streamlining Siri's AI/ML Data Pipeline
Streamlining Siri's AI/ML Data Pipeline
Streamlining Siri's AI/ML Data Pipeline
Reduce the number of third-party tools, all while increasing the efficiency of Siri projects by improving workflow transparency, project tracking, and data accuracy for the global Siri AI/ML team.
Reduce the number of third-party tools, all while increasing the efficiency of Siri projects by improving workflow transparency, project tracking, and data accuracy for the global Siri AI/ML team.
Reduce the number of third-party tools, all while increasing the efficiency of Siri projects by improving workflow transparency, project tracking, and data accuracy for the global Siri AI/ML team.


Industry
Industry
Technology - AI/ML
Technology - AI/ML
Technology - AI/ML
Role
Role
Lead Interaction Designer
Lead Interaction Designer
Lead Interaction Designer
Year
Year
2022
2022
2022
Platform
Platform
Web
Web
Web
Overview
At Apple, I was part of the Siri team, where I focused on improving the AI/ML and voice recognition systems behind the “Hey Siri” experience. My work helped boost accuracy and reduce false activations across 37 languages, making Siri more responsive and reliable in all kinds of real-world environments. I partnered closely with data engineers, natural language analysts, and product managers to refine wake-word detection and design five internal tools that ensured that clean, high-quality data flowed through the system.
At Apple, I was part of the Siri team, where I focused on improving the AI/ML and voice recognition systems behind the “Hey Siri” experience. My work helped boost accuracy and reduce false activations across 37 languages, making Siri more responsive and reliable in all kinds of real-world environments. I partnered closely with data engineers, natural language analysts, and product managers to refine wake-word detection and design five internal tools that ensured that clean, high-quality data flowed through the system.
At Apple, I was part of the Siri team, where I focused on improving the AI/ML and voice recognition systems behind the “Hey Siri” experience. My work helped boost accuracy and reduce false activations across 37 languages, making Siri more responsive and reliable in all kinds of real-world environments. I partnered closely with data engineers, natural language analysts, and product managers to refine wake-word detection and design five internal tools that ensured that clean, high-quality data flowed through the system.
Result
From client ingestion to data QA, I streamlined the entire project lifecycle to support continuous model improvement. The end result? A more intuitive, consistent voice interface that supports Apple’s goal of making Siri effortlessly helpful for users around the world.
From client ingestion to data QA, I streamlined the entire project lifecycle to support continuous model improvement. The end result? A more intuitive, consistent voice interface that supports Apple’s goal of making Siri effortlessly helpful for users around the world.
From client ingestion to data QA, I streamlined the entire project lifecycle to support continuous model improvement. The end result? A more intuitive, consistent voice interface that supports Apple’s goal of making Siri effortlessly helpful for users around the world.
85%
Reduction in 3rd party Tools
Reduction in 3rd party Tools
4X
Project Creation
Project Creation
20%
↑ ENPS Rate for Managers
↑ ENPS Rate for Managers
RESULT
RESULT
Product Launch
Product Launch
Product Launch
Reworking Apple’s internal operations wasn’t an option, but reducing friction and simplifying manual processes was key to making this project a success. The final designs, while intuitive and straightforward, helped solve some of the most complex workflows across multiple teams and platforms. Below are some of the main screens that brought everything together, ensuring efficiency, usability, and seamless integration.
Explore the case study below to understand the process that helped build these exciting set of features.
PROCESS
PROCESS
Design Thinking
Design Thinking
Design Thinking
By following the six-step Design Thinking process—Empathize, Define, Ideate, Prototype, Test, and Implement—I developed a structured approach to solving key challenges faced by enterprise data teams. This process ensured that our solution was user-centered, technically feasible, and aligned with business goals.
By following the six-step Design Thinking process—Empathize, Define, Ideate, Prototype, Test, and Implement—I developed a structured approach to solving key challenges faced by enterprise data teams. This process ensured that our solution was user-centered, technically feasible, and aligned with business goals.
By following the six-step Design Thinking process—Empathize, Define, Ideate, Prototype, Test, and Implement—I developed a structured approach to solving key challenges faced by enterprise data teams. This process ensured that our solution was user-centered, technically feasible, and aligned with business goals.
Research
Research
Empathy Building Research
Research
EMPATHIZE
EMPATHIZE
Research
Research
Research
Quantitative Findings
Collaborating with multiple Siri team Product Managers, I worked to analyze the individual team key metrics and align them with a global approach. We conducted a time and tooling audit across 12 global locales to understand the operational impact of manual tracking. Key findings:
- 100% of participants expressed frustration with the multiple tools required to manage a project's life cycle.
- Manual processes relied on 7 disconnected tools to manage end-to-end project tracking.
- One manager spent 40 hours/week on manual tracking tasks.
Across 12 managers, that totaled 480 hours/week—the equivalent of 12 full-time workweeks lost weekly.
Estimated productivity loss: $36,000/week or ~$1.8M/year.
Collaborating with multiple Siri team Product Managers, I worked to analyze the individual team key metrics and align them with a global approach. We conducted a time and tooling audit across 12 global locales to understand the operational impact of manual tracking. Key findings:
100% of participants expressed frustration with the multiple tools required to manage a project's life cycle.
Manual processes relied on 7 disconnected tools to manage end-to-end project tracking.
One manager spent 40 hours/week on manual tracking tasks.
Across 12 managers, that totaled 480 hours/week—the equivalent of 12 full-time workweeks lost weekly.
Estimated productivity loss: $36,000/week or ~$1.8M/year.
100%
Participants Felt Frustrated
7+
Third Party Tools Used
~ $1.8M
Estimated Productivity Loss
EMPATHIZE
EMPATHIZE
Research
Research
Research
Qualitative Findings
Tracking success with hard numbers was important, but at the heart of the Siri team’s work were the Natural Language Analysts—the real MVPs behind the scenes. These global teams spend hours parsing through data, fine-tuning it for ML model training, and ensuring everything runs smoothly. They know how critical their role is, and they feel the pressure to get it right. So, making their workflows easier, more efficient, and even a little more fulfilling was a top priority.
To make sure we were solving the right problems, I went straight to the source—talking to analysts, AI/ML engineers, and product managers to understand what wasn’t working.
Conducted over 20 hours of user interviews with Natural Language Analysts, AI/ML Engineers, and Product Managers.
Used "5 Whys" methodology to uncover root causes of workflow pain points.
Identified Jobs to Be Done (JTBD) for key stakeholders.
Key Findings
Our research uncovered two primary personas—managers overseeing project lifecycles and analysts handling data labeling—that highlighted critical workflow gaps. We found that managers lacked visibility into team progress, analysts were burdened with repetitive tasks that compromised data quality, and Data Ops teams were losing valuable time to manual validation. These inefficiencies collectively slowed down AI/ML development and pointed to clear opportunities for automation and workflow redesign.
Managers lacked visibility into team progress, causing workflow slowdowns
Analysts were bogged down by repetitive tasks, hurting data quality
Data Ops teams spent too much time manually validating data, delaying model improvements
Personas
Personas
Personas
Personas


DEFINE
DEFINE
Personas
Personas
Personas
Persona Based Problem Statements
Talking to the global team gave me a chance to uncover key challenges that were holding them back and shape a clear direction for improving their workflows. By listening to their experiences, I was able to identify the biggest pain points and define the "Jobs to Be Done" that would make their day-to-day work smoother and more efficient. Key Problem Statements:
Talking to the global team gave me a chance to uncover key challenges that were holding them back and shape a clear direction for improving their workflows. By listening to their experiences, I was able to identify the biggest pain points and define the "Jobs to Be Done" that would make their day-to-day work smoother and more efficient. Key Problem Statements:
Talking to the global team gave me a chance to uncover key challenges that were holding them back and shape a clear direction for improving their workflows. By listening to their experiences, I was able to identify the biggest pain points and define the "Jobs to Be Done" that would make their day-to-day work smoother and more efficient. Key Problem Statements:
Problem Statements
"I need a quick way to see my team’s overall performance with the option to zoom in on specific people or locations, so I can coach effectively and keep projects on track."
"I need a quick way to see my team’s overall performance with the option to zoom in on specific people or locations, so I can coach effectively and keep projects on track."
Manager Persona
"It’s stressful not knowing if my work is properly recorded or tracked. I need real-time confirmation so I can focus on my job without distractions."
"It’s stressful not knowing if my work is properly recorded or tracked. I need real-time confirmation so I can focus on my job without distractions."
Analyst Persona
"I rely entirely on our internal ticketing system, but Siri data projects aren’t properly tracked there. I need integration into Radar so I don’t have to jump between multiple tools just to fix an issue."
"I rely entirely on our internal ticketing system, but Siri data projects aren’t properly tracked there. I need integration into Radar so I don’t have to jump between multiple tools just to fix an issue."
Data Engineer Persona

Ideate
Ideate
Ideate
Ideate
IDEATE
IDEATE
User Flows
User Flows
User Flows
One big hurdle was that teams working on the same project often had no visibility into each other’s work due to strict privacy policies. With up to nine teams working on a single Siri initiative, it was tough to track dependencies or coordinate efforts. On top of that, the internal tool ecosystem was fragmented, with teams relying on a mix of homegrown solutions and separate tracking tools, leading to inefficiencies and duplicated work. Solving for the creation of a project that reduced redundancies and allowed for transparency across teams was the first workflow I tackled.
One big hurdle was that teams working on the same project often had no visibility into each other’s work due to strict privacy policies. With up to nine teams working on a single Siri initiative, it was tough to track dependencies or coordinate efforts. On top of that, the internal tool ecosystem was fragmented, with teams relying on a mix of homegrown solutions and separate tracking tools, leading to inefficiencies and duplicated work. Solving for the creation of a project that reduced redundancies and allowed for transparency across teams was the first workflow I tackled.
One big hurdle was that teams working on the same project often had no visibility into each other’s work due to strict privacy policies. With up to nine teams working on a single Siri initiative, it was tough to track dependencies or coordinate efforts. On top of that, the internal tool ecosystem was fragmented, with teams relying on a mix of homegrown solutions and separate tracking tools, leading to inefficiencies and duplicated work. Solving for the creation of a project that reduced redundancies and allowed for transparency across teams was the first workflow I tackled.

PROTOTYPE
PROTOTYPE
Prototype Testing
Prototype Testing
Prototype Testing
By facilitating user testing sessions with managers and analysts in Japan, Seattle, and Ireland, I was able to confirm and refine the overall workflows for key user roles. These sessions provided valuable insights into how different teams interact with the system and helped ensure that the new workflow improvements met their needs.
By facilitating user testing sessions with managers and analysts in Japan, Seattle, and Ireland, I was able to confirm and refine the overall workflows for key user roles. These sessions provided valuable insights into how different teams interact with the system and helped ensure that the new workflow improvements met their needs.
By facilitating user testing sessions with managers and analysts in Japan, Seattle, and Ireland, I was able to confirm and refine the overall workflows for key user roles. These sessions provided valuable insights into how different teams interact with the system and helped ensure that the new workflow improvements met their needs.
Prototype 1
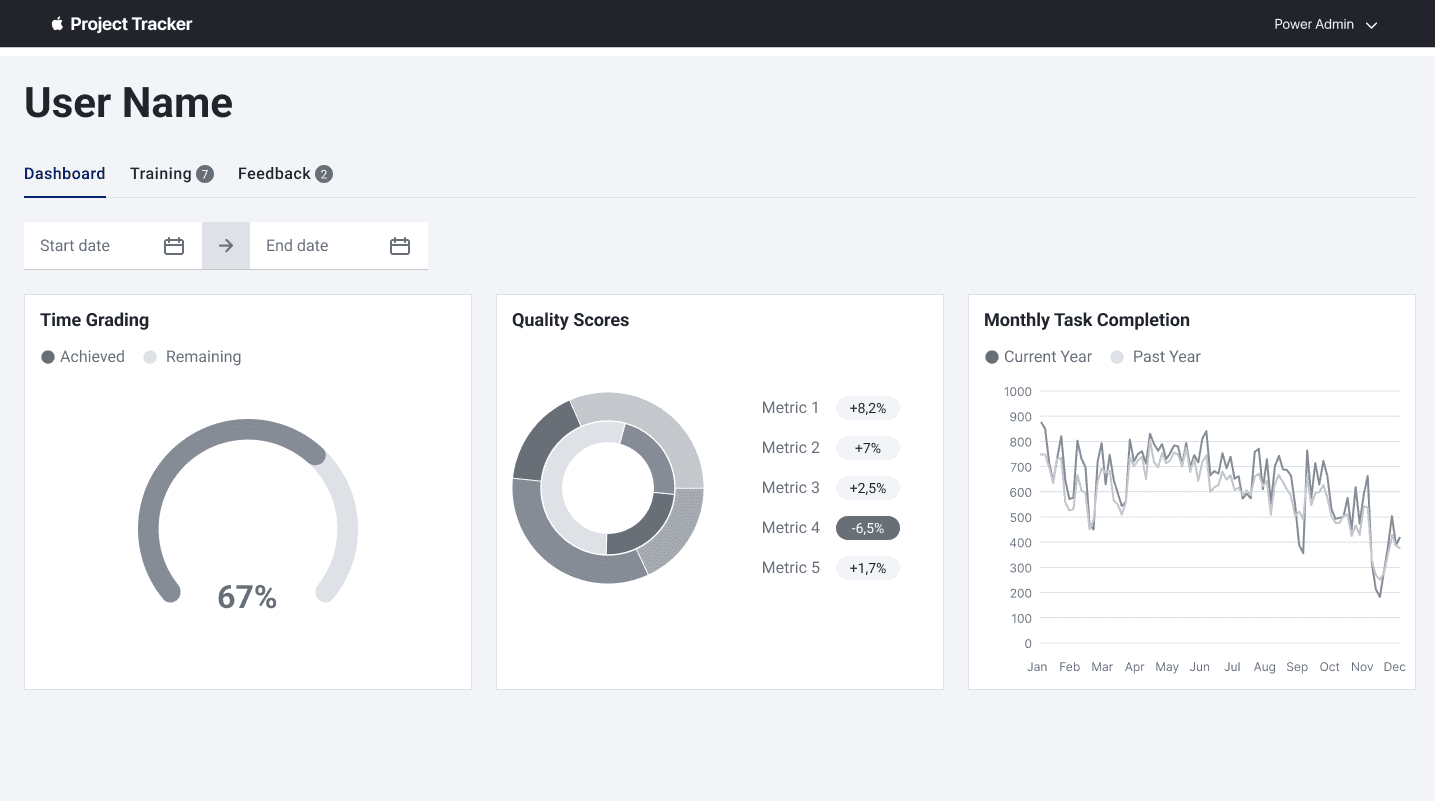
In Prototype 1, I tested large metric cards with bold numbers and colored charts to keep key stats front and center—great for visual learners. It offered quick insights, but lacked top-level metadata for added context.
Prototype 1
Prototype 2
Prototype 3
Prototype 1
In Prototype 1, I tested large metric cards with bold numbers and colored charts to keep key stats front and center—great for visual learners. It offered quick insights, but lacked top-level metadata for added context.
Prototype 1
Prototype 2
Prototype 3
TEST
TEST
User Testing Scenario
User Testing Scenario
User Testing Scenario
The user testing scenarios aligned with the qualitative research findings from the user interviews I conducted earlier in the project, making sure I was demonstrating the user’s needs in the problems we were solving.
Scenario 1: As a QA Admin, I need to create a new project, add reviewers, specify the locales it covers, upload a CSV, and link it to Radar. I need to seamlessly transition my project from draft to running.
Scenario 2: As a manager, I need to access my project dashboard, view my team's performance at a global level, and drill down by locale to analyze trends and improve decision-making.
TEST
TEST
Success Metrics
Success Metrics
Success Metrics
I made sure to capture the success metrics called out in the quantitive research findings as a way to align with the multiple Siri team KPI’s and ensure team adoption.
Task completion time (create a new project) was reduced by 75%, making workflows 4x faster and freeing up valuable time for higher-priority tasks.
7 external tools were consolidated into a single integrated system, eliminating inefficiencies, reducing context switching, and improving overall workflow consistency and visibility.
Out of all the locations that users were interviewed, 100% prefered the new UX/UI over the old.
Project Creation
4X
Tool Reduction
85%
User Satisfaction
100%
Implementing Feedback
Implementing Feedback
Implementing Feedback
Implementing Feedback
IMPLEMENT
User Feedback
User Feedback
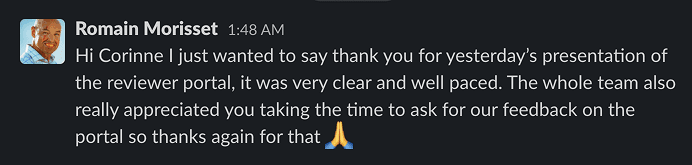
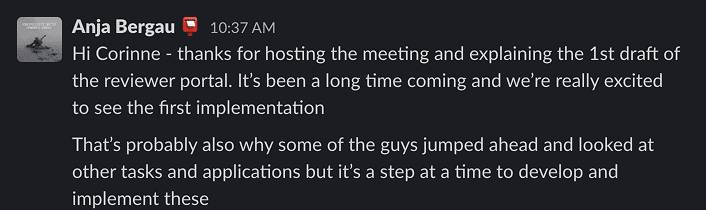
Right after the user tests, I started getting messages from participants who were excited to see their feedback come to life in a real, tangible way. Seeing their ideas and needs reflected in the product made them feel heard, and that was incredibly rewarding. Tackling such a complex web of workflows and turning it into something clear and usable was not just a win for the team—it was genuinely satisfying to see it all come together.
Right after the user tests, I started getting messages from participants who were excited to see their feedback come to life in a real, tangible way. Seeing their ideas and needs reflected in the product made them feel heard, and that was incredibly rewarding. Tackling such a complex web of workflows and turning it into something clear and usable was not just a win for the team—it was genuinely satisfying to see it all come together.


IMPLEMENT
IMPLEMENT
Final Design
Final Design
Final Design
In the final design, I blended the best elements from all prototypes to support both visual and logical learners. From Prototype 1, I kept large, above-the-fold charts that highlight key metrics like time on task—directly addressing user feedback about visibility and quick comprehension. Prototype 2 inspired the inclusion of detailed metadata, now placed below the fold in a clean table with clear column headers aligned to the project creation flow. From Prototype 3, I brought in a structured, table-based layout for logical comparison, while still enhancing usability with visual cues like assigned grader avatars for quick recognition. I also added drill-in options across all metrics, so users could dive deeper into team- or location-specific data without applying extra filters—ensuring a streamlined, intuitive experience grounded in real user needs.
In the final design, I blended the best elements from all prototypes to support both visual and logical learners. From Prototype 1, I kept large, above-the-fold charts that highlight key metrics like time on task—directly addressing user feedback about visibility and quick comprehension. Prototype 2 inspired the inclusion of detailed metadata, now placed below the fold in a clean table with clear column headers aligned to the project creation flow. From Prototype 3, I brought in a structured, table-based layout for logical comparison, while still enhancing usability with visual cues like assigned grader avatars for quick recognition. I also added drill-in options across all metrics, so users could dive deeper into team- or location-specific data without applying extra filters—ensuring a streamlined, intuitive experience grounded in real user needs.
In the final design, I blended the best elements from all prototypes to support both visual and logical learners. From Prototype 1, I kept large, above-the-fold charts that highlight key metrics like time on task—directly addressing user feedback about visibility and quick comprehension. Prototype 2 inspired the inclusion of detailed metadata, now placed below the fold in a clean table with clear column headers aligned to the project creation flow. From Prototype 3, I brought in a structured, table-based layout for logical comparison, while still enhancing usability with visual cues like assigned grader avatars for quick recognition. I also added drill-in options across all metrics, so users could dive deeper into team- or location-specific data without applying extra filters—ensuring a streamlined, intuitive experience grounded in real user needs.