machine learning
machine learning
Revolutionizing Feature Engineering for Scalable Machine Learning
Revolutionizing Feature Engineering for Scalable Machine Learning
Accelerate AI-powered model development by streamlining feature engineering workflows through intuitive design, real-time data transformation, and seamless operationalization—establishing a scalable foundation that led to successful funding and acquisition.
Accelerate AI-powered model development by streamlining feature engineering workflows through intuitive design, real-time data transformation, and seamless operationalization—establishing a scalable foundation that led to successful funding and acquisition.


Industry
Technology - AI/ML
Role
Head of Product Design
Year
2020
Platform
Web
Overview
Kaskada is a Feature Engineering Studio designed to help data scientists and ML engineers create, transform, and manage features efficiently for machine learning models. It enables seamless feature creation, transformation, and storage, supporting both real-time and batch processing. With built-in governance, data lineage tracking, and operationalization, Kaskada ensures reproducibility and scalability while integrating with feature stores for consistent training and inference. Through the designs, research, and development of the MVP, Kaskada successfully secured over $10 million in Series A funding and established product-market fit, proving its value in streamlining feature engineering workflows and accelerating model development for AI-driven applications.
Kaskada is a Feature Engineering Studio designed to help data scientists and ML engineers create, transform, and manage features efficiently for machine learning models. It enables seamless feature creation, transformation, and storage, supporting both real-time and batch processing. With built-in governance, data lineage tracking, and operationalization, Kaskada ensures reproducibility and scalability while integrating with feature stores for consistent training and inference. Through the designs, research, and development of the MVP, Kaskada successfully secured over $10 million in Series A funding and established product-market fit, proving its value in streamlining feature engineering workflows and accelerating model development for AI-driven applications.
Kaskada is a Feature Engineering Studio designed to help data scientists and ML engineers create, transform, and manage features efficiently for machine learning models. It enables seamless feature creation, transformation, and storage, supporting both real-time and batch processing. With built-in governance, data lineage tracking, and operationalization, Kaskada ensures reproducibility and scalability while integrating with feature stores for consistent training and inference. Through the designs, research, and development of the MVP, Kaskada successfully secured over $10 million in Series A funding and established product-market fit, proving its value in streamlining feature engineering workflows and accelerating model development for AI-driven applications.
Kaskada is a Feature Engineering Studio designed to help data scientists and ML engineers create, transform, and manage features efficiently for machine learning models. It enables seamless feature creation, transformation, and storage, supporting both real-time and batch processing. With built-in governance, data lineage tracking, and operationalization, Kaskada ensures reproducibility and scalability while integrating with feature stores for consistent training and inference. Through the designs, research, and development of the MVP, Kaskada successfully secured over $10 million in Series A funding and established product-market fit, proving its value in streamlining feature engineering workflows and accelerating model development for AI-driven applications.
Result
In January 2023, DataStax, a real-time AI company, acquired Kaskada to enhance its capabilities in delivering instant, actionable insights for AI applications. This acquisition aimed to integrate Kaskada's technology into DataStax's portfolio, enabling organizations to build applications infused with real-time AI. Following the acquisition, DataStax announced plans to open-source Kaskada's core technology and develop a new machine-learning cloud service.
In January 2023, DataStax, a real-time AI company, acquired Kaskada to enhance its capabilities in delivering instant, actionable insights for AI applications. This acquisition aimed to integrate Kaskada's technology into DataStax's portfolio, enabling organizations to build applications infused with real-time AI. Following the acquisition, DataStax announced plans to open-source Kaskada's core technology and develop a new machine-learning cloud service.
In January 2023, DataStax, a real-time AI company, acquired Kaskada to enhance its capabilities in delivering instant, actionable insights for AI applications. This acquisition aimed to integrate Kaskada's technology into DataStax's portfolio, enabling organizations to build applications infused with real-time AI. Following the acquisition, DataStax announced plans to open-source Kaskada's core technology and develop a new machine-learning cloud service.
In January 2023, DataStax, a real-time AI company, acquired Kaskada to enhance its capabilities in delivering instant, actionable insights for AI applications. This acquisition aimed to integrate Kaskada's technology into DataStax's portfolio, enabling organizations to build applications infused with real-time AI. Following the acquisition, DataStax announced plans to open-source Kaskada's core technology and develop a new machine-learning cloud service.
$10M
Funding Secured
75%
Time Saved
Zero
Code UI
RESULT
Product Launch
What once took months of back-and-forth between teams was now reduced to days, thanks to Kaskada—the first-of-its-kind, no-code feature engineering studio with a UI built specifically for data scientists. Its intuitive interface enabled visual comparisons out of the box, facilitating rapid iteration, cross-team collaboration, and seamless deployment, ultimately accelerating the journey from raw data to production-ready features.
Explore the case study below to understand the process that helped build these exciting set of features.
Research

EMPATHIZE
Research
Research
Quantitative Findings
Historically, feature engineering was a highly fragmented and manual process, slowing down the deployment of machine learning models and causing significant inefficiencies across data teams. Without centralized tools, data scientists, ML engineers, and data engineers operated in silos—leading to redundant work, inconsistent features between training and production, and brittle pipelines. In 2019, several key metrics highlighted these challenges:
60–80% of a data scientist’s time was spent on data preparation and feature engineering due to manual workflows and lack of tooling.
Over 50% of ML models experienced performance degradation when moving from training to production, largely due to inconsistent features and data drift.
Up to 30% of features were redundantly built across teams, wasting engineering resources and slowing iteration.
60-80%
80%
80%
Time Spent on Data Prep
Time Spent on Data Prep
Time Spent on Data Prep
50%
ML Models Experiencing Degration
ML Models Experiencing Degration
ML Models Experiencing Degration
30%
Redundency of Features
Redundency of Features
Redundency of Features
EMPATHIZE
Research
Qualitative Findings
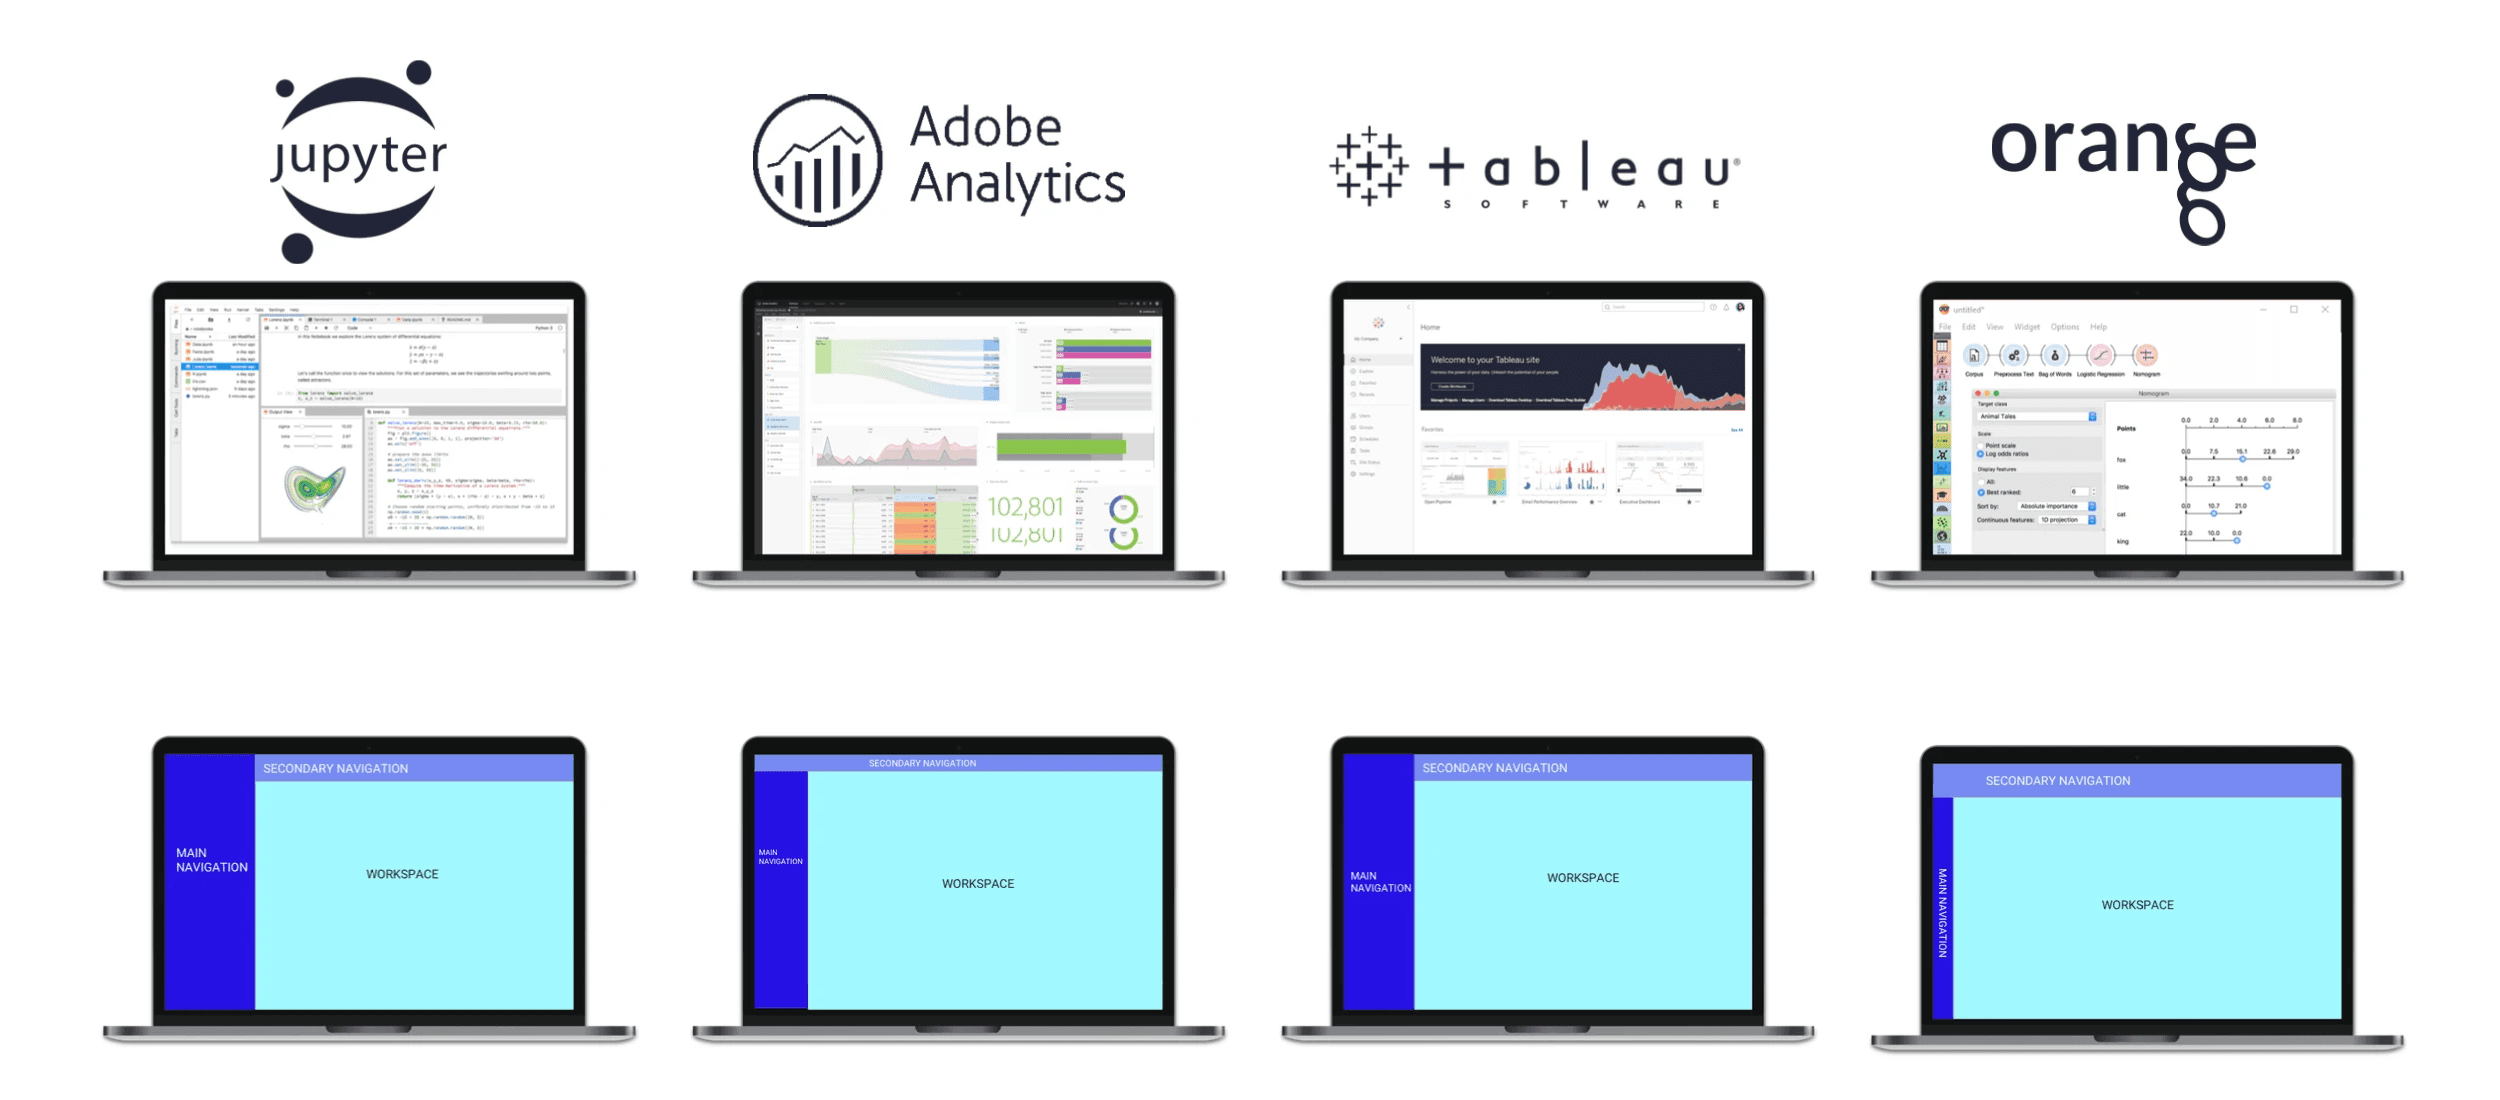
To design an intuitive Information Architecture (IA) for Kaskada, I conducted in-depth competitive market research using industry-standard tools like Jupyter, Adobe Analytics, Tableau, and Orange to understand how users navigate and interact with data-driven interfaces. These platforms each provided valuable insights:
Jupyter: Users expect a left-to-right flow when working with data, mirroring the way code cells execute sequentially in notebooks.
Adobe Analytics & Tableau: These analytics tools emphasize visual hierarchy and modular workspaces, where users can drag, drop, and manipulate data elements dynamically.
Orange: As a visual programming and ML workflow tool, Orange provided insights into how users construct data pipelines, reinforcing the need for an IA that supports modular, reusable components for building and testing features.
PROCESS
Design Thinking
Design Thinking
By following the six-step Design Thinking process—Empathize, Define, Ideate, Prototype, Test, and Implement—I developed a structured approach to solving key challenges faced by enterprise data teams. This process ensured that our solution was user-centered, technically feasible, and aligned with business goals.
By following the six-step Design Thinking process—Empathize, Define, Ideate, Prototype, Test, and Implement—I developed a structured approach to solving key challenges faced by enterprise data teams. This process ensured that our solution was user-centered, technically feasible, and aligned with business goals.
By following the six-step Design Thinking process—Empathize, Define, Ideate, Prototype, Test, and Implement—I developed a structured approach to solving key challenges faced by enterprise data teams. This process ensured that our solution was user-centered, technically feasible, and aligned with business goals.
By following the six-step Design Thinking process—Empathize, Define, Ideate, Prototype, Test, and Implement—I developed a structured approach to solving key challenges faced by enterprise data teams. This process ensured that our solution was user-centered, technically feasible, and aligned with business goals.
Clarity Through Architecture
Clarity Through Architecture

DEFINE
Personas
Personas
Persona Based Problem Statements
To effectively serve Kaskada’s core personas—the company (decision makers), data scientists (end users), and data engineers (indirect beneficiaries)—I designed the Information Architecture (IA) to reflect their distinct needs while aligning with familiar UX patterns from industry tools.
To effectively serve Kaskada’s core personas—the company (decision makers), data scientists (end users), and data engineers (indirect beneficiaries)—I designed the Information Architecture (IA) to reflect their distinct needs while aligning with familiar UX patterns from industry tools.
To effectively serve Kaskada’s core personas—the company (decision makers), data scientists (end users), and data engineers (indirect beneficiaries)—I designed the Information Architecture (IA) to reflect their distinct needs while aligning with familiar UX patterns from industry tools.
To effectively serve Kaskada’s core personas—the company (decision makers), data scientists (end users), and data engineers (indirect beneficiaries)—I designed the Information Architecture (IA) to reflect their distinct needs while aligning with familiar UX patterns from industry tools.
Architecture
Key Findings
I structured Kaskada’s IA to support a seamless flow from data selection → feature transformation → model integration → deployment. The central workspace was designed as a real-time, interactive canvas for feature iteration—meeting data scientists’ need for fast, intuitive exploration, while producing production-ready, code-compatible features for data engineers. At the same time, the streamlined, scalable architecture demonstrated to company decision-makers that Kaskada was a smart, user-centered investment capable of accelerating ML workflows across the board.
I structured Kaskada’s IA to support a seamless flow from data selection → feature transformation → model integration → deployment. The central workspace was designed as a real-time, interactive canvas for feature iteration—meeting data scientists’ need for fast, intuitive exploration, while producing production-ready, code-compatible features for data engineers. At the same time, the streamlined, scalable architecture demonstrated to company decision-makers that Kaskada was a smart, user-centered investment capable of accelerating ML workflows across the board.
I structured Kaskada’s IA to support a seamless flow from data selection → feature transformation → model integration → deployment. The central workspace was designed as a real-time, interactive canvas for feature iteration—meeting data scientists’ need for fast, intuitive exploration, while producing production-ready, code-compatible features for data engineers. At the same time, the streamlined, scalable architecture demonstrated to company decision-makers that Kaskada was a smart, user-centered investment capable of accelerating ML workflows across the board.
I structured Kaskada’s IA to support a seamless flow from data selection → feature transformation → model integration → deployment. The central workspace was designed as a real-time, interactive canvas for feature iteration—meeting data scientists’ need for fast, intuitive exploration, while producing production-ready, code-compatible features for data engineers. At the same time, the streamlined, scalable architecture demonstrated to company decision-makers that Kaskada was a smart, user-centered investment capable of accelerating ML workflows across the board.
Problem Statements
"Our organization struggles to scale machine learning efforts because feature engineering is inconsistent, inefficient, and costly. We need a solution that ensures reliability between training and production while accelerating time-to-market for AI-driven products."
Company (Buyer | Decision Maker)
Company (Buyer | Decision Maker)
"Creating, testing, and deploying features is slow and fragmented, forcing me to switch between coding environments and manual processes. I need a no-code, intuitive tool that lets me iterate, validate, and export features quickly without heavy engineering support."
Data Scientist (End User)
"Handoff between data science and engineering often results in misaligned, brittle pipelines that require extra time to clean, validate, and operationalize features. I need feature outputs that are production-ready, consistent, and easy to integrate with minimal rework."
Data Engineer (Indirect Beneficiary)
Ideate
IDEATE
Mid-Fidelity
Leading with a strong UX foundation, I drove 6 rapid design iterations grounded in real user feedback. By quickly refining the information architecture and workflow, I minimized risk, accelerated innovation, and delivered a user experience that met both market and team needs.
Leading with a strong UX foundation, I drove 6 rapid design iterations grounded in real user feedback. By quickly refining the information architecture and workflow, I minimized risk, accelerated innovation, and delivered a user experience that met both market and team needs.
Leading with a strong UX foundation, I drove 6 rapid design iterations grounded in real user feedback. By quickly refining the information architecture and workflow, I minimized risk, accelerated innovation, and delivered a user experience that met both market and team needs.
Leading with a strong UX foundation, I drove 6 rapid design iterations grounded in real user feedback. By quickly refining the information architecture and workflow, I minimized risk, accelerated innovation, and delivered a user experience that met both market and team needs.

PROTOTYPE
User Testing
User Testing
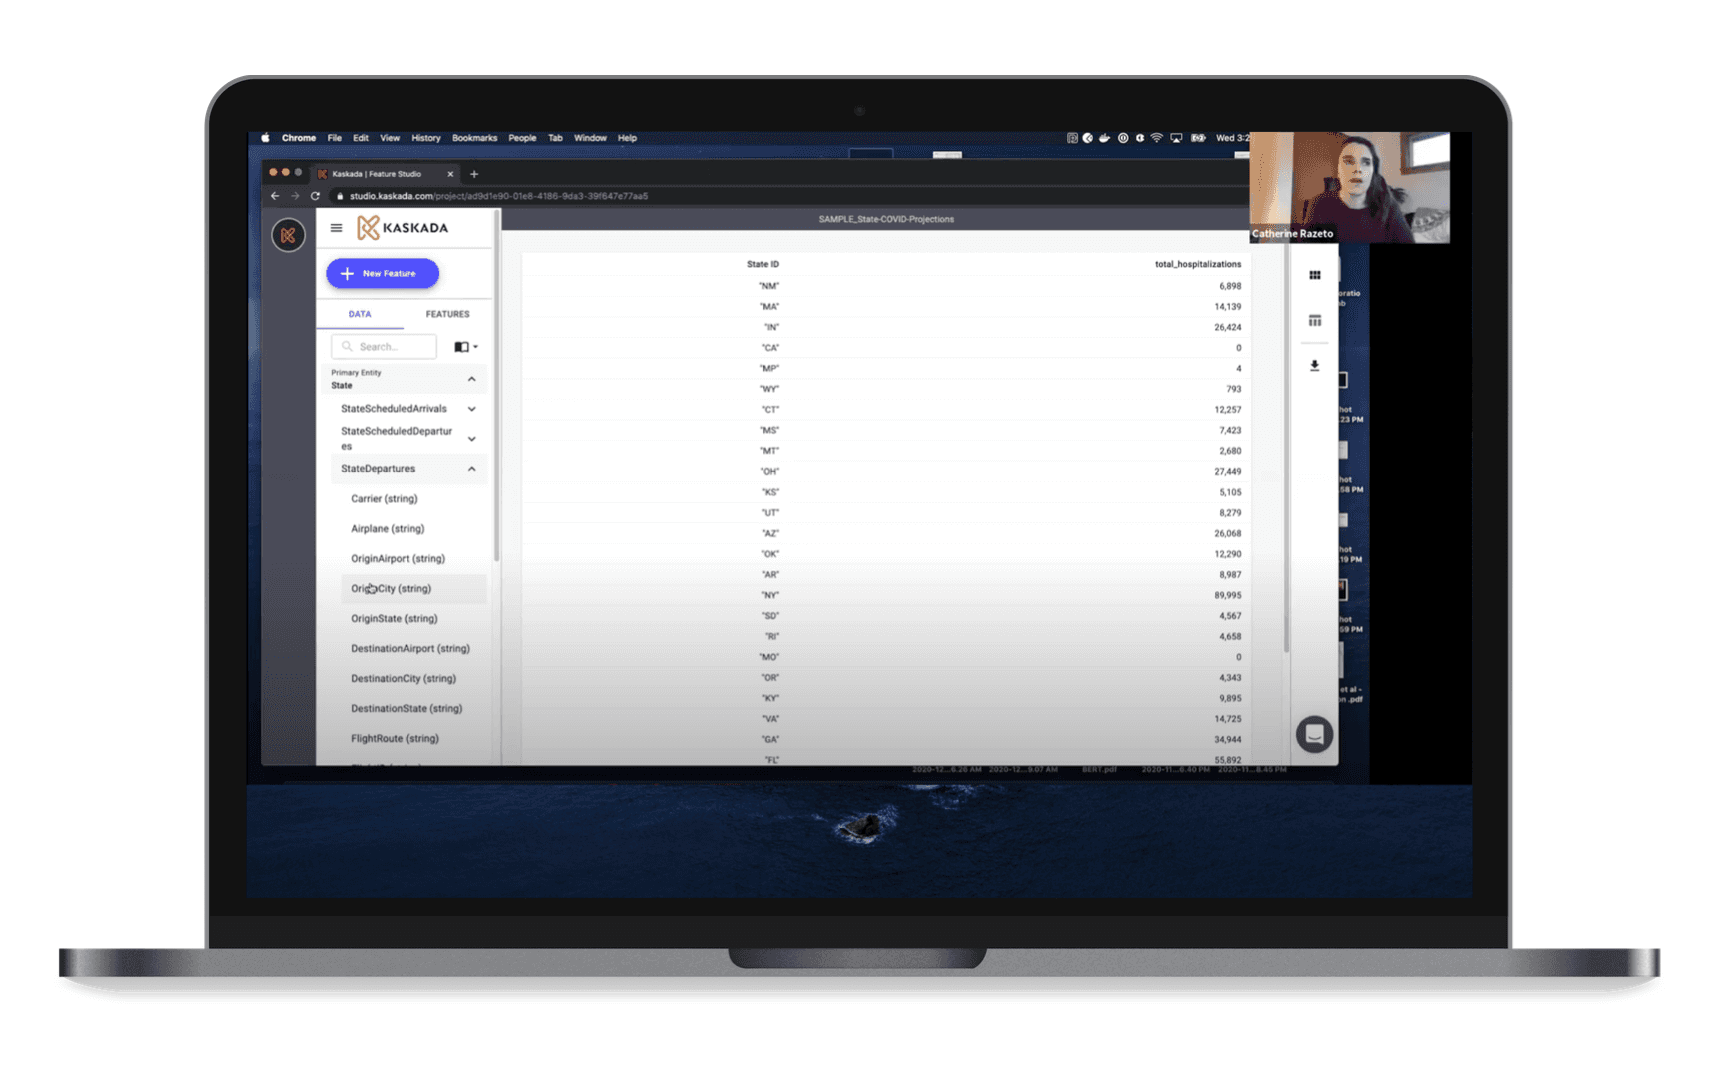
To shape a product that truly met user needs and market demand, I led a fast-paced, iterative design process grounded in continuous feedback. Over the course of 6 rapid iterations, I refined features based on real user input—minimizing development risk and accelerating innovation. Through 20+ hours of product-market fit interviews and 12 user tests across multiple prototypes, I validated assumptions, uncovered critical user behaviors, and aligned the design with both user expectations and business goals—resulting in a more focused, user-driven product.
To shape a product that truly met user needs and market demand, I led a fast-paced, iterative design process grounded in continuous feedback. Over the course of 6 rapid iterations, I refined features based on real user input—minimizing development risk and accelerating innovation. Through 20+ hours of product-market fit interviews and 12 user tests across multiple prototypes, I validated assumptions, uncovered critical user behaviors, and aligned the design with both user expectations and business goals—resulting in a more focused, user-driven product.
To shape a product that truly met user needs and market demand, I led a fast-paced, iterative design process grounded in continuous feedback. Over the course of 6 rapid iterations, I refined features based on real user input—minimizing development risk and accelerating innovation. Through 20+ hours of product-market fit interviews and 12 user tests across multiple prototypes, I validated assumptions, uncovered critical user behaviors, and aligned the design with both user expectations and business goals—resulting in a more focused, user-driven product.
To shape a product that truly met user needs and market demand, I led a fast-paced, iterative design process grounded in continuous feedback. Over the course of 6 rapid iterations, I refined features based on real user input—minimizing development risk and accelerating innovation. Through 20+ hours of product-market fit interviews and 12 user tests across multiple prototypes, I validated assumptions, uncovered critical user behaviors, and aligned the design with both user expectations and business goals—resulting in a more focused, user-driven product.
TEST
User Testing Scenario
User Testing Scenario
Evaluate how effectively a data scientist can define, validate, and organize a feature schema using the visual schema builder without writing code.
You’ve been asked to prepare a set of features for a churn prediction model.
Scenario 1: Using the visual schema builder, drag and drop the relevant data fields from a raw dataset, define data types, set basic constraints (e.g., null allowed, data range), and organize the fields into logical groups (e.g., customer behavior, account details).
Scenario 2: After defining the schema, save it as a reusable template and export it with your team for review.
TEST
Success Metrics
Success Metrics
Even though the end user of the product was a data scientist, the key metrics tracked demonstrated value across the entire team and organization by improving efficiency, usability, and collaboration.
Task Completion Rate: 90% of users successfully completed all steps without external help, showing the interface was intuitive and easy to use.
Time to Schema Creation: On average, users were able to define and validate a complete schema in just 5 minutes, significantly reducing setup time.
Collaboration Clarity Score: Users rated schema clarity at 4.5 out of 5, indicating strong confidence in team-wide understanding and reusability.
Task Completion Rate
Task Completion Rate
90% +
Time to Schema Creation
Time to Schema Creation
~ 5 min
Collaboration Clarity Score
Collaboration Clarity Score
4.5 out of 5
Complex Code to Clean Clickable UI
Complex Code to Clean Clickable UI
IMPLEMENT
JTBD
JTBD
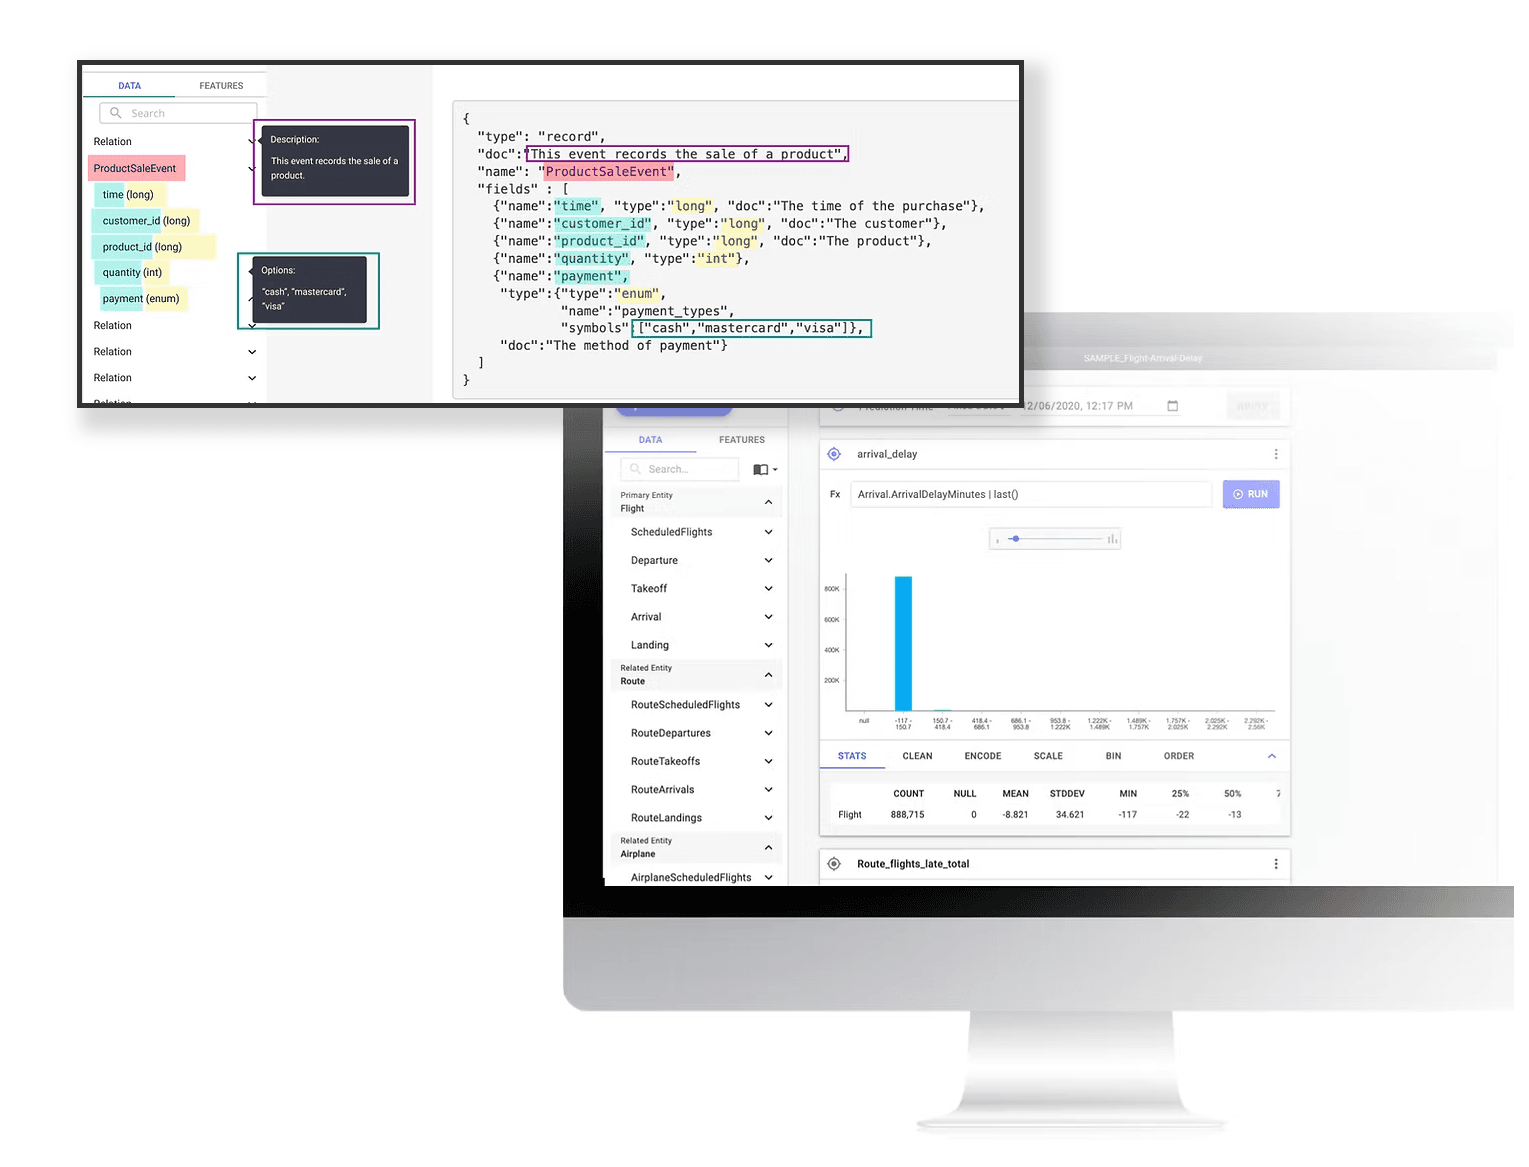
In the Jobs-to-Be-Done (JTBD) framework, schemas play a critical role in structuring and standardizing data to ensure consistency and efficiency in machine learning workflows. By transforming complex, multi-line code into a clean, clickable folder structure, we created a UI-driven visual schema that made defining, validating, and managing features more intuitive and interactive—helping data scientists work faster and with greater confidence.
In the Jobs-to-Be-Done (JTBD) framework, schemas play a critical role in structuring and standardizing data to ensure consistency and efficiency in machine learning workflows. By transforming complex, multi-line code into a clean, clickable folder structure, we created a UI-driven visual schema that made defining, validating, and managing features more intuitive and interactive—helping data scientists work faster and with greater confidence.
In the Jobs-to-Be-Done (JTBD) framework, schemas play a critical role in structuring and standardizing data to ensure consistency and efficiency in machine learning workflows. By transforming complex, multi-line code into a clean, clickable folder structure, we created a UI-driven visual schema that made defining, validating, and managing features more intuitive and interactive—helping data scientists work faster and with greater confidence.
In the Jobs-to-Be-Done (JTBD) framework, schemas play a critical role in structuring and standardizing data to ensure consistency and efficiency in machine learning workflows. By transforming complex, multi-line code into a clean, clickable folder structure, we created a UI-driven visual schema that made defining, validating, and managing features more intuitive and interactive—helping data scientists work faster and with greater confidence.

IMPLEMENT
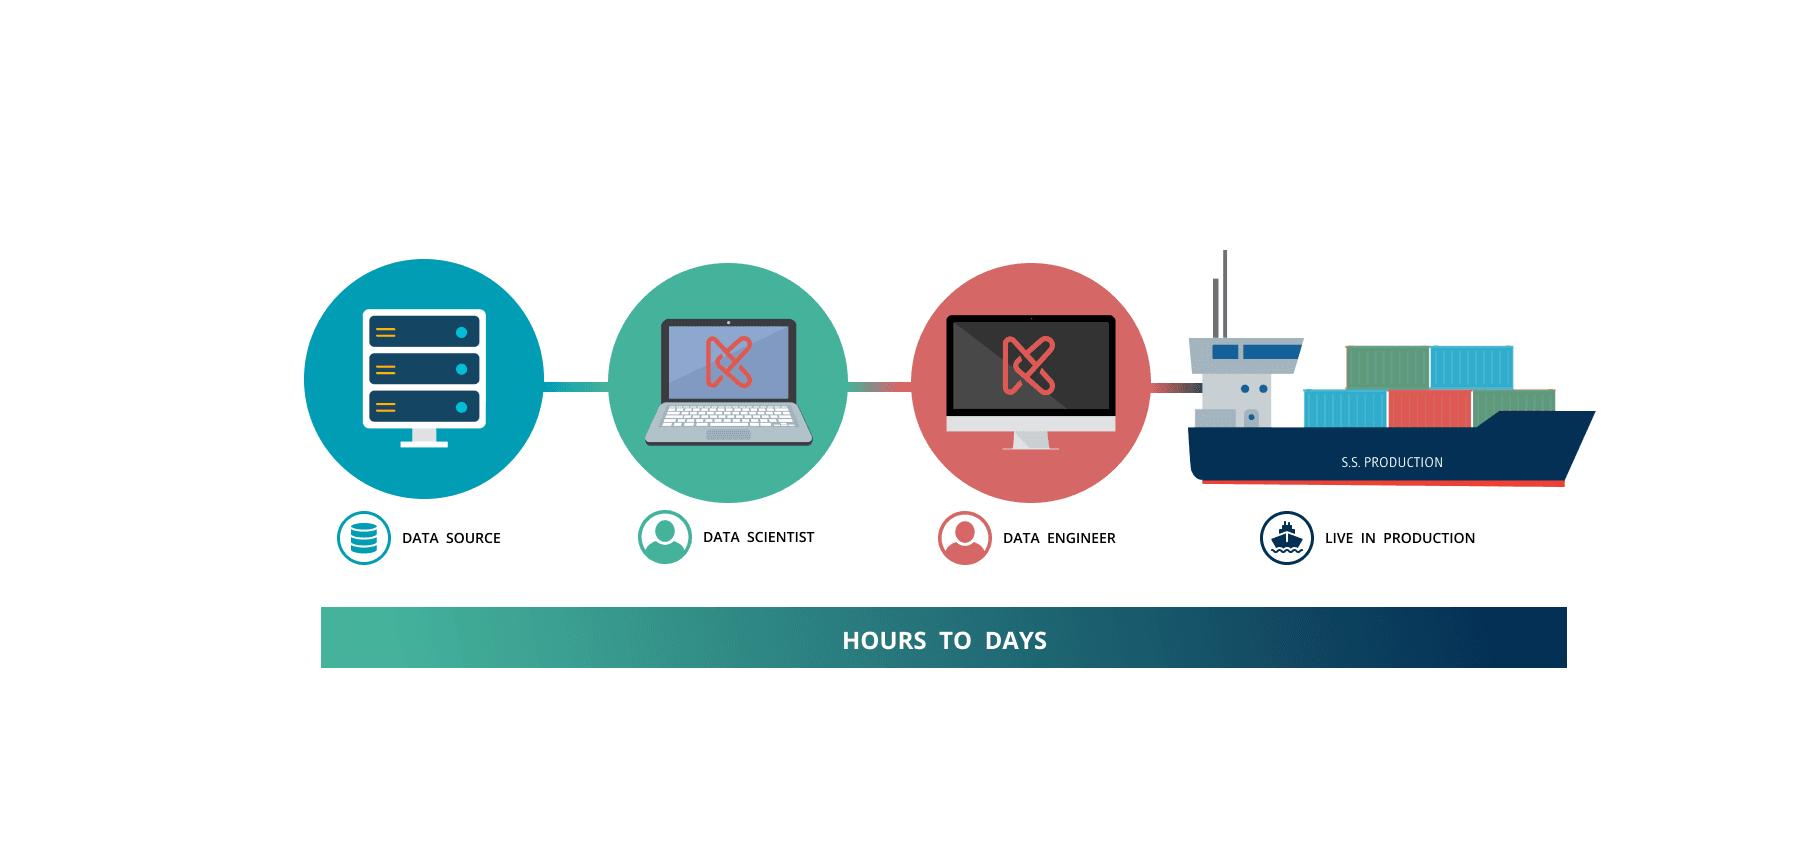
Customer Journey
The Kaskada platform connected all consumers of data pipelines, resulting in cleaner, more accurate, and faster feature engineering. By introducing a UI-driven visual schema, data scientists could now define, validate, and manage schemas interactively, reducing complexity and minimizing errors. This transformation allowed users to quickly explore feature dependencies, track lineage, and enforce data governance in real-time, eliminating the need for manual schema definitions and reducing the risk of inconsistencies.
What once took months of back-and-forth between teams was now reduced to days, as the platform’s intuitive UI facilitated rapid iteration, cross-team collaboration, and seamless deployment, ultimately accelerating the journey from raw data to production-ready features.